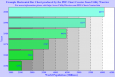
Engineering Chart
Advertisement

LightningChart Ultimate SDK v.2.0.1
LightningChart Ultimate is the fastest 2D and 3D measurement, engineering and research data visualization SDK for .NET and Windows.
Advertisement
Code Visual to Flow chart v.3 3
Code Visual to Flowchart is a program Flow chart generator for code flowcharting and visualization.It can perform automated reverse engineering of program code into programming flowcharts . ,help programmers to document,visualize and understand

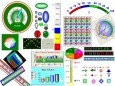
RPN Engineering Calculator
Programmable RPN calculator, Over 250 solutions with 6 keypads: Standard, Engineering, Binary, Magnetics, Trig, and Convert. You can select Fixed, Scientific, or Engineering notation and Degrees, Radians, or Grads for your calculations. Has a running tape

Swiftchart: chart, graph java applet
Chart java applet software to generate dynamic charts and graphs - bar, line, pie, stacked and grouped charts in 2D and 3D with a wide range of parameters and chart types. Main features: Charts in 2D/3D, Anti aliasing, Multi language support, Cross

Java Chart Designer
Create professionally looking presentations and reports with Java Chart Designer. Feature rich and powerful application gives you full power to create outstanding report and presentation projects. A user-friendly interface, great number of visual effects
PDF Chart Creator Dynamic Link Library
The PDF Chart Creator Dynamic Link Library is a utility that will create charts from data as a PDF document. The conversion process is fully controlled through the provided Application Programming Interface and the royalty free DLL can be included and
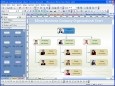
Edraw Organizational Chart v.7.8
Edraw is a new organization chart drawing software, which creates organisation charts and business charts with minimum time loss for you. Support basic flowcharts, organizational charts, business charts, hr diagram and work flowchart.

Dragonfly Chart .Net
.Net Window Form Chart Components including DAS_Net_PieChart, DAS_Net_FlatPieChart, DAS_Net_3DPieChart, DAS_Net_BarChart, DAS_Net_FlatBarChart, DAS_Net_XYChart and DAS_Net_AngularChart and others provide powerful chart functionalities which can meet
Graphic-Chart ActiveX Components
ActiveX Automation Components including Scope, Chart, Plotter, PieChart, BarChart, 3D Components, Indicator, Gauge, ProgressBar, Ruler, Temperature Control, AlphaNumeric LED, Counter and others can be widely applied in many industry HMI applications and
Animated Chart Pro - Flash Chart Software
Animated Chart creates dynamic flash charts to publish them to web sites. All items and structures of flash charts are customizable with clicking the chart preview. Select a flash chart type: Area, Bar, Bubble, Column, Doughnut, Line, Pie, Scatter, Radar,
Competitive Matrix Feature Chart
The competitive matrix feature comparison chart help you to create a matrix to compare product features. This can be used internally for product planning or externally for sales purposes. Also includes "Top 10 Product Launch Mistakes" White Paper.